
- MS PowerPoint
- Apple Keynote
- Google Slides
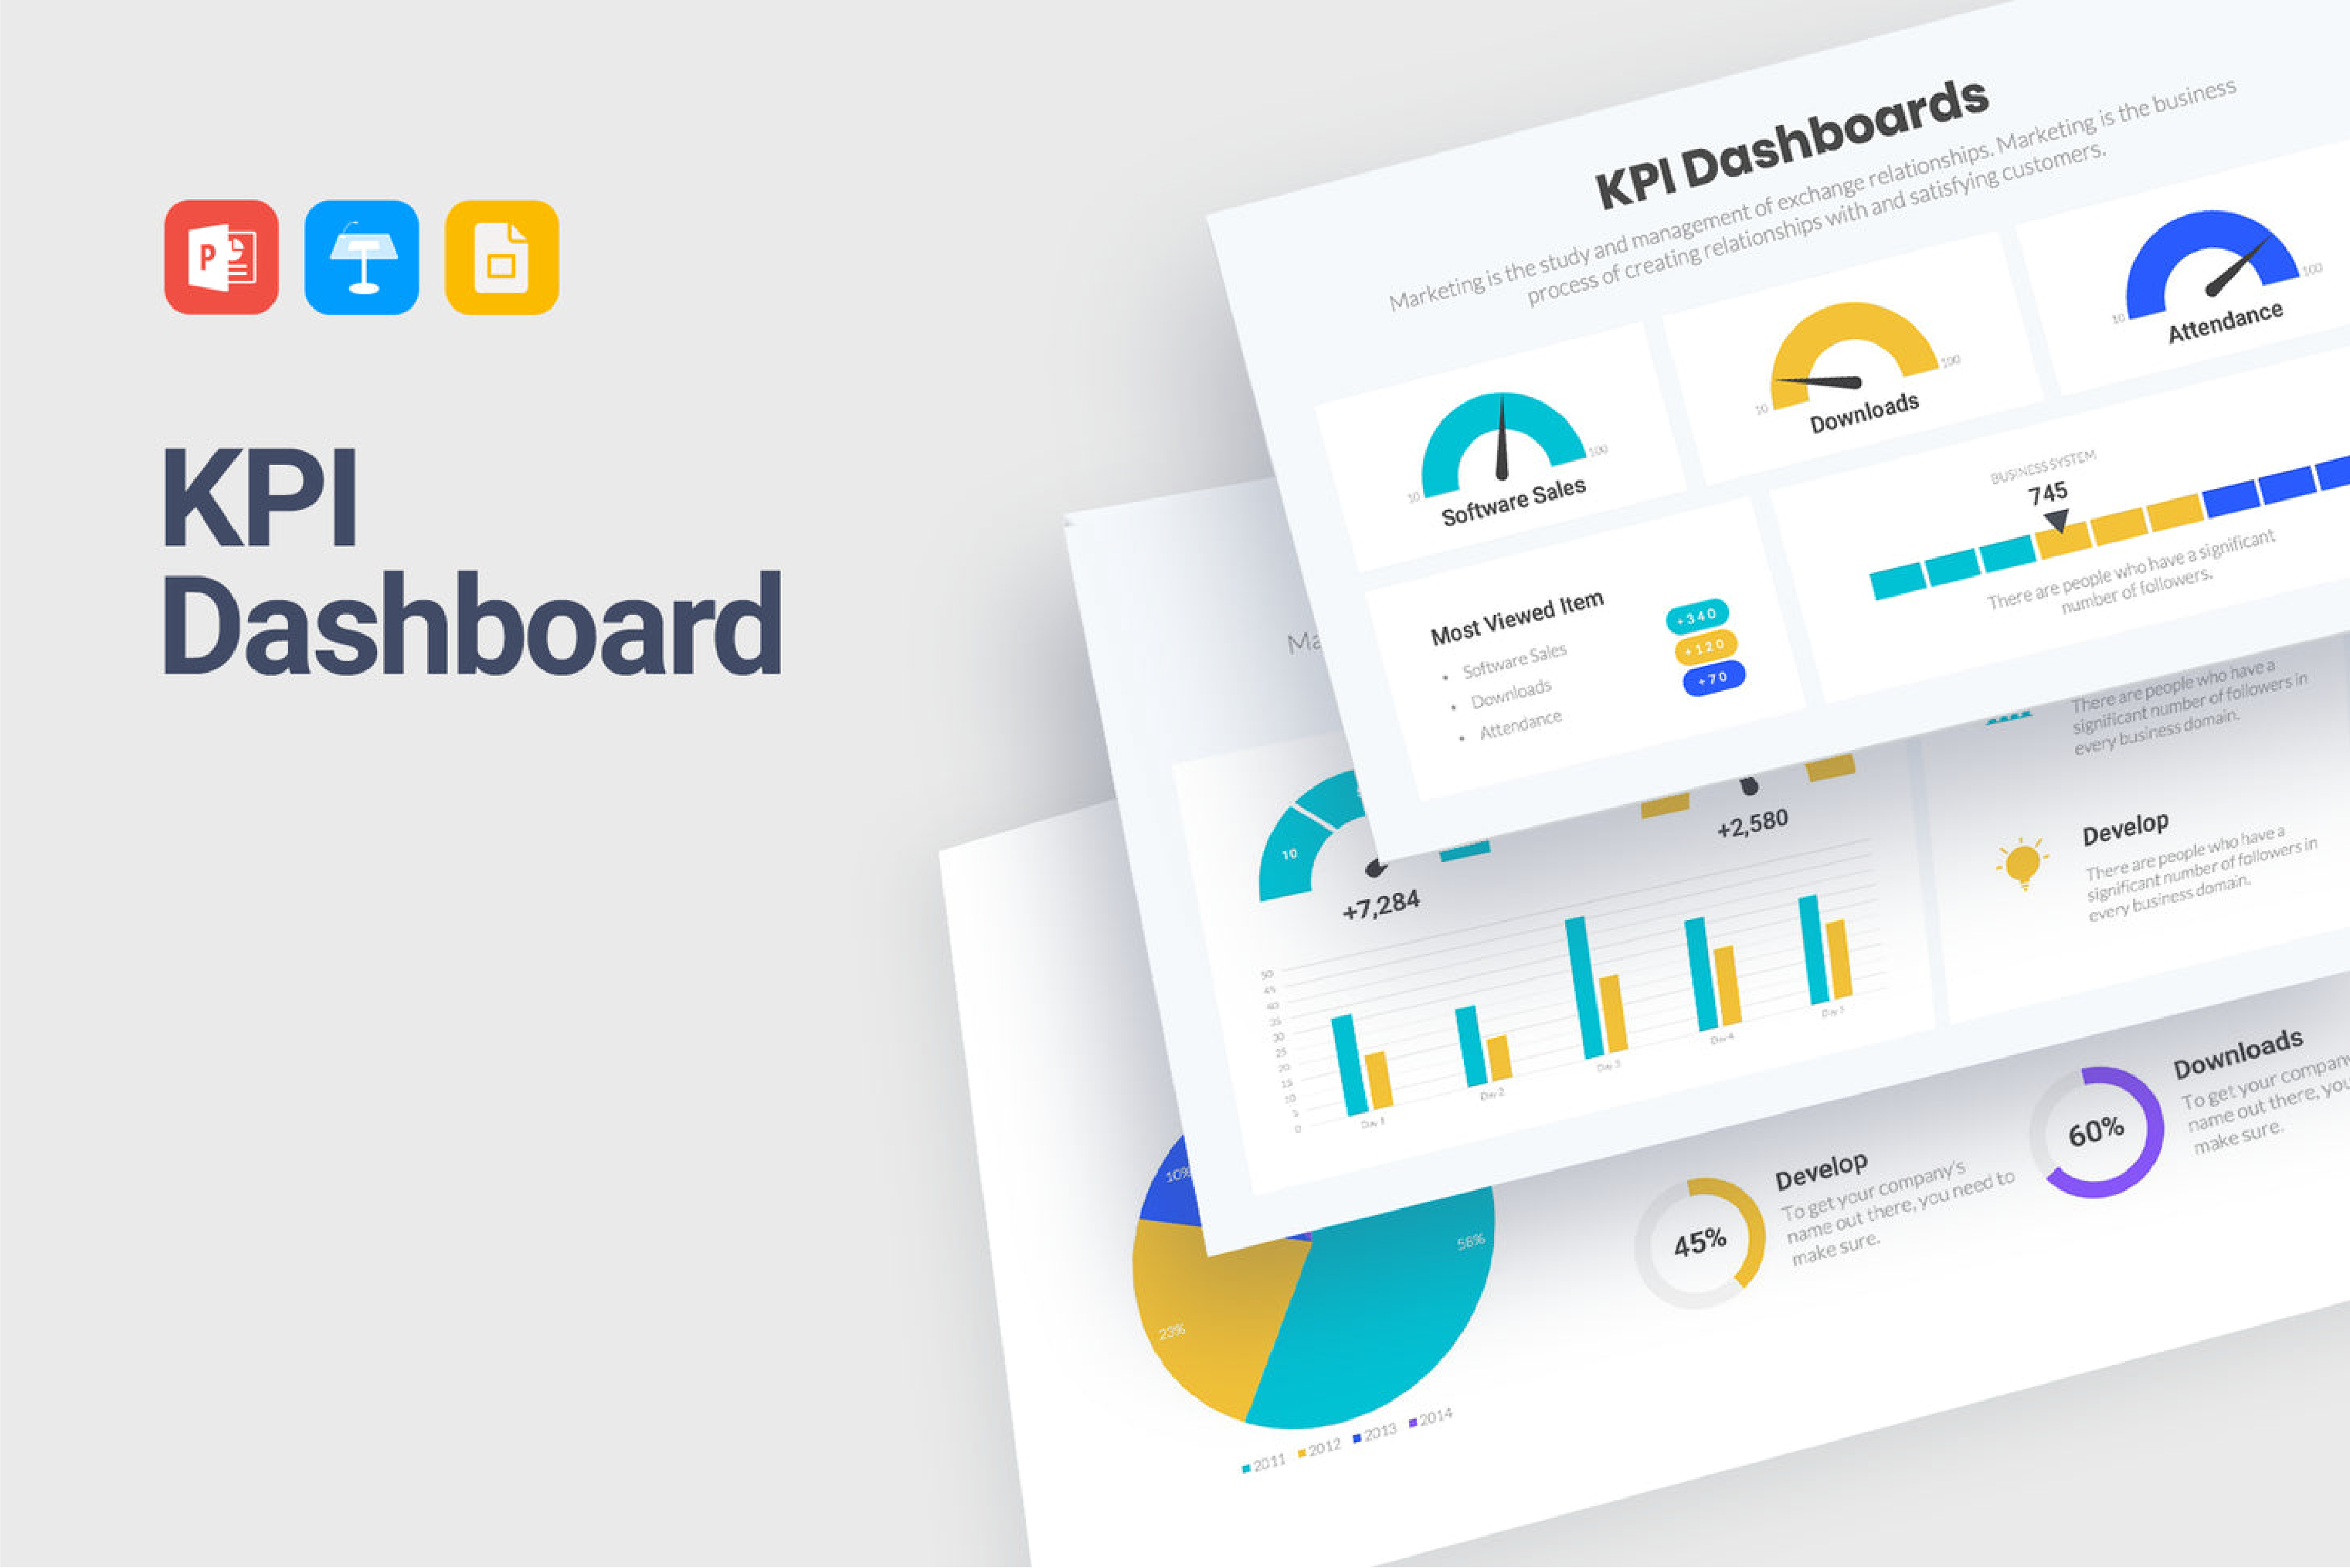


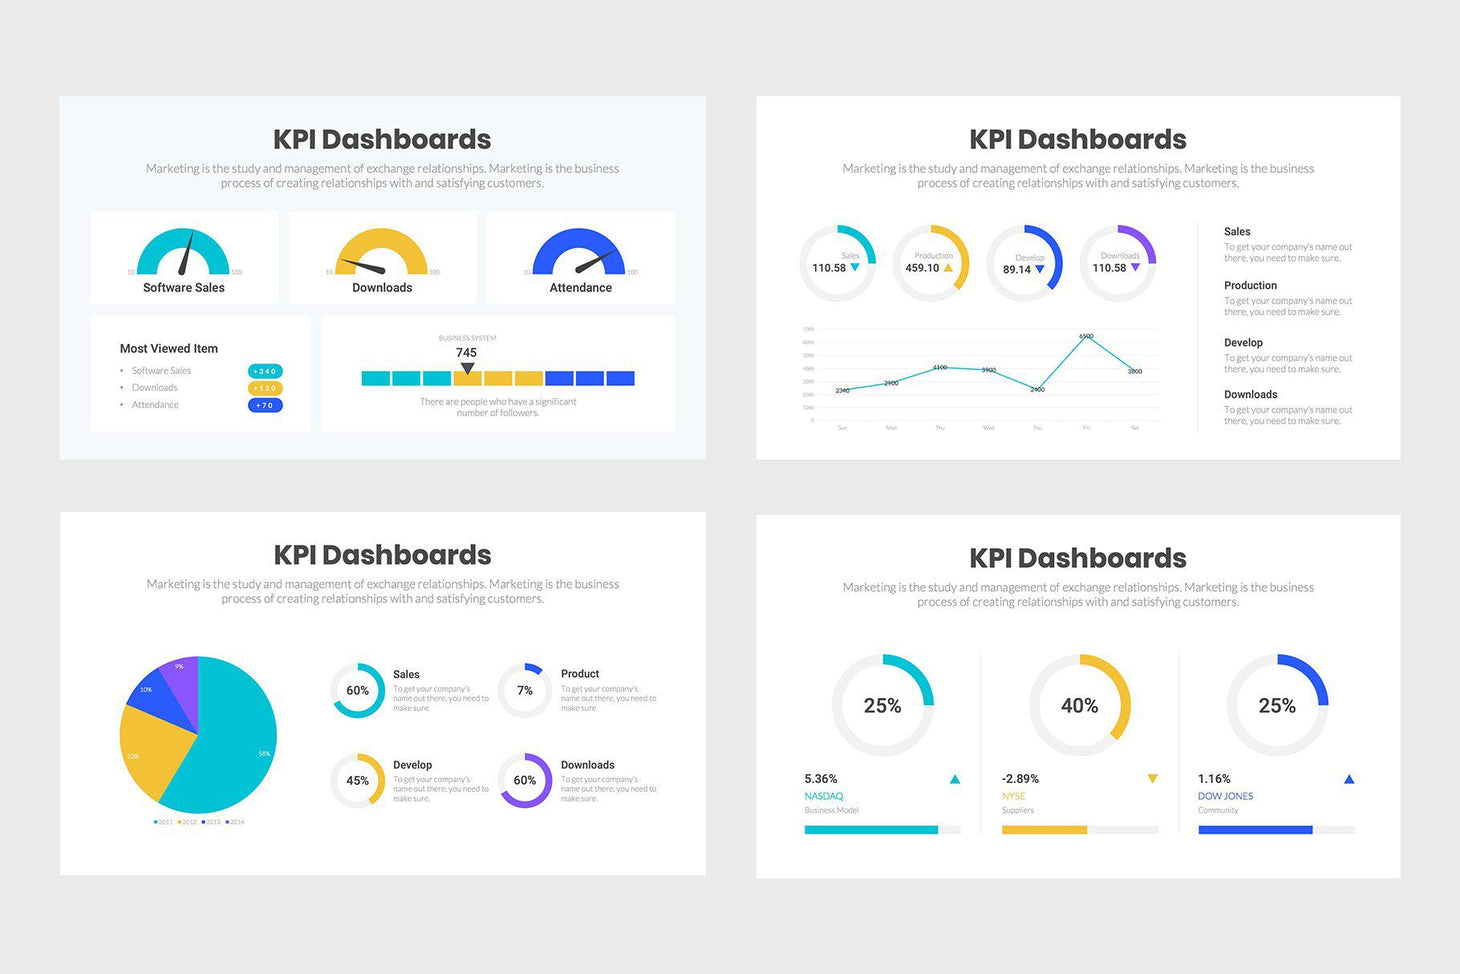

KPI Dashboard Infographics Bundle
₵150.00
Compatible With
Description
Description
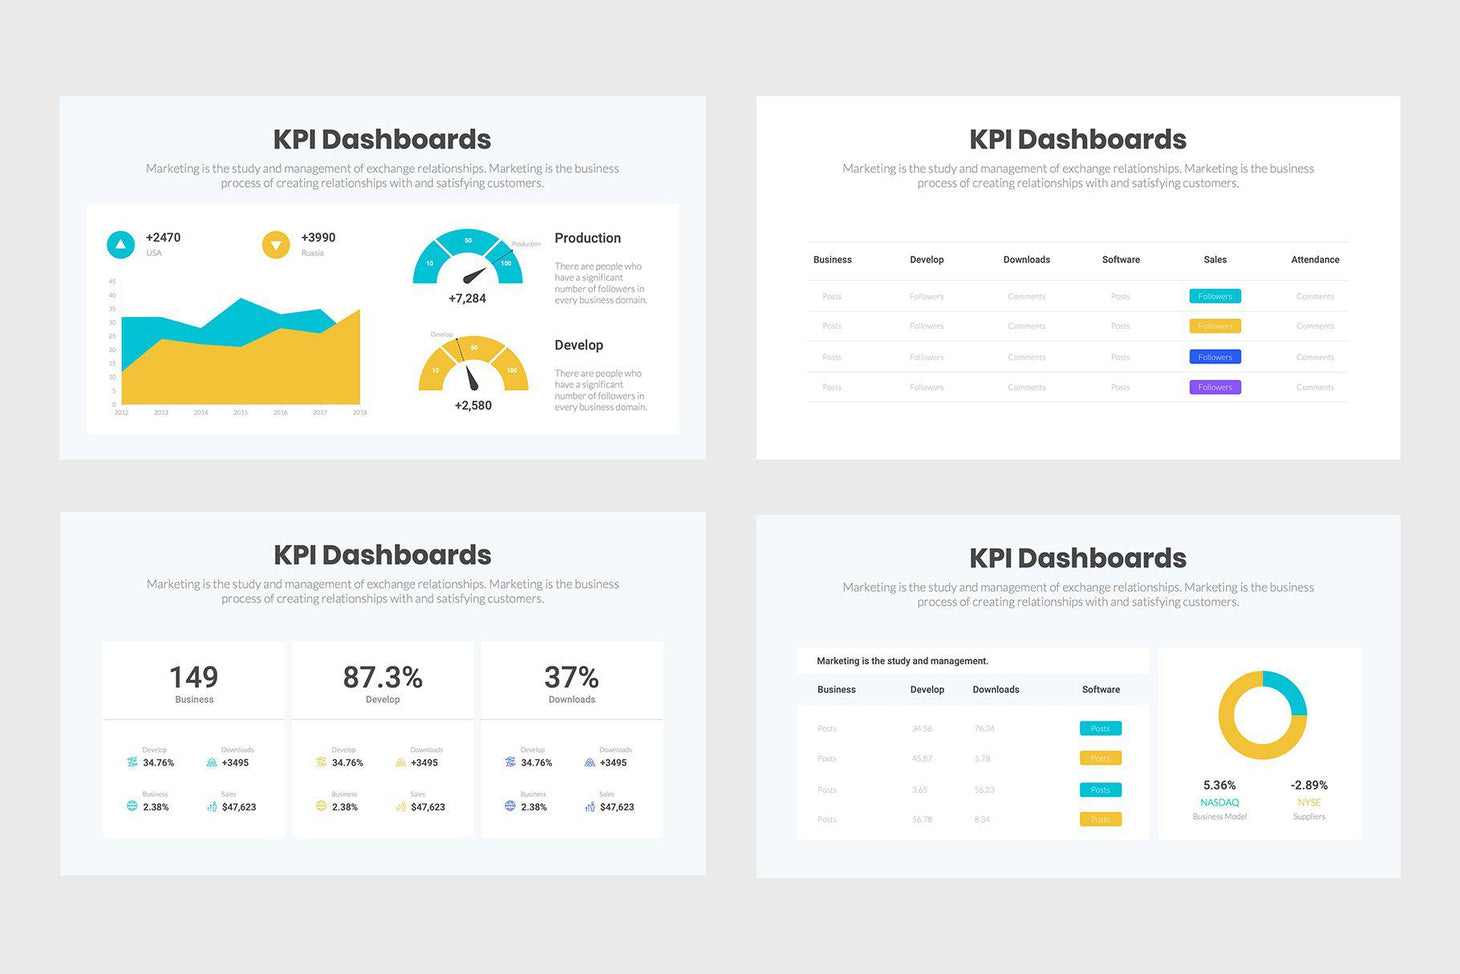
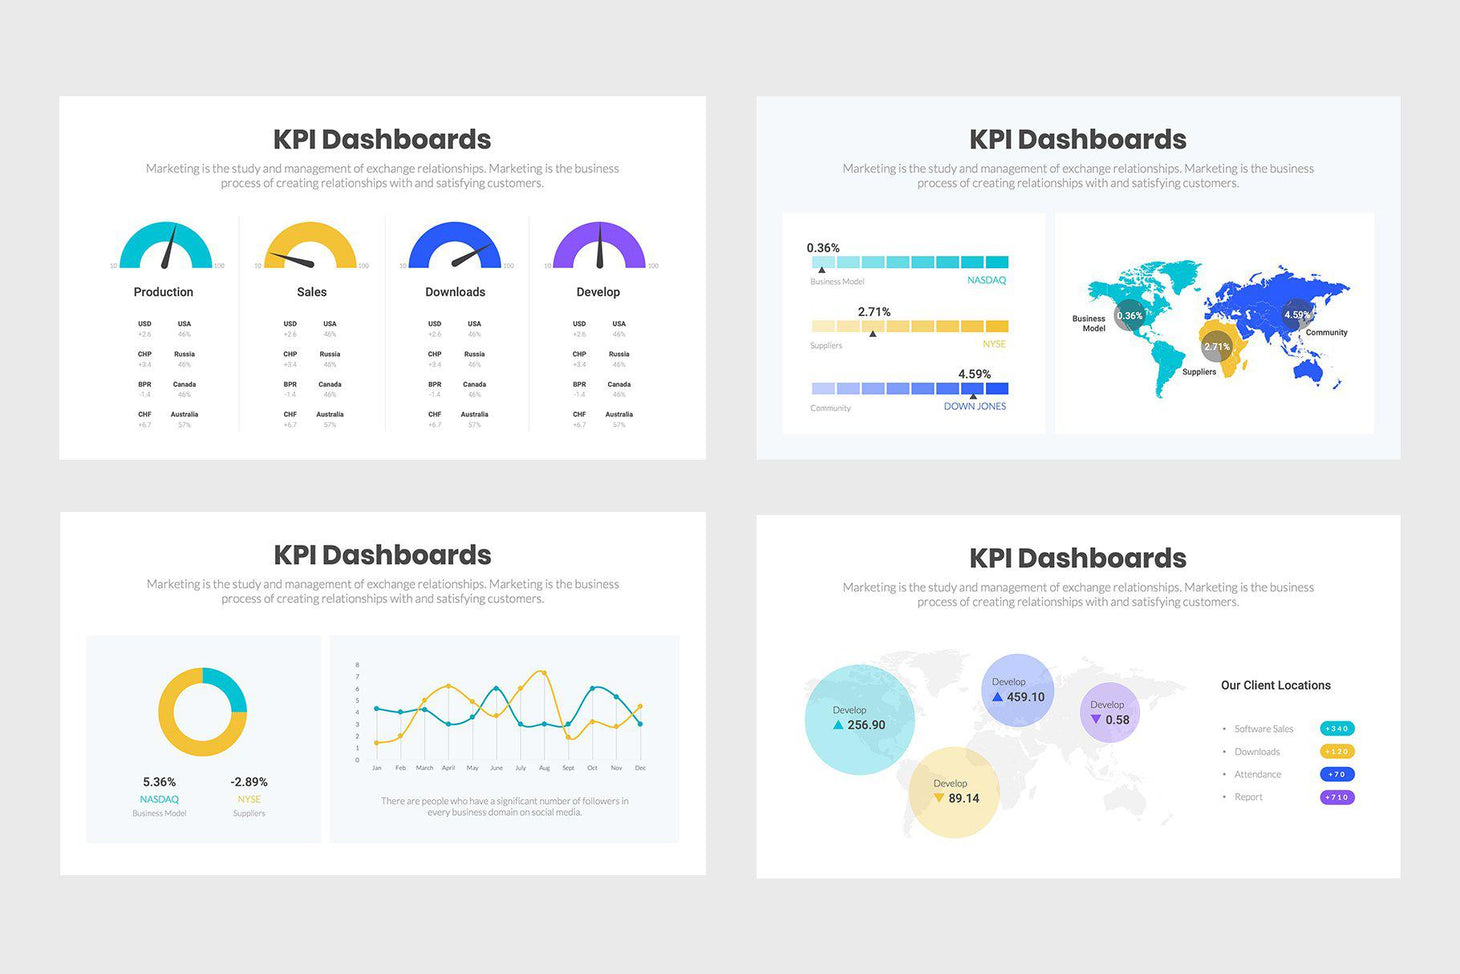
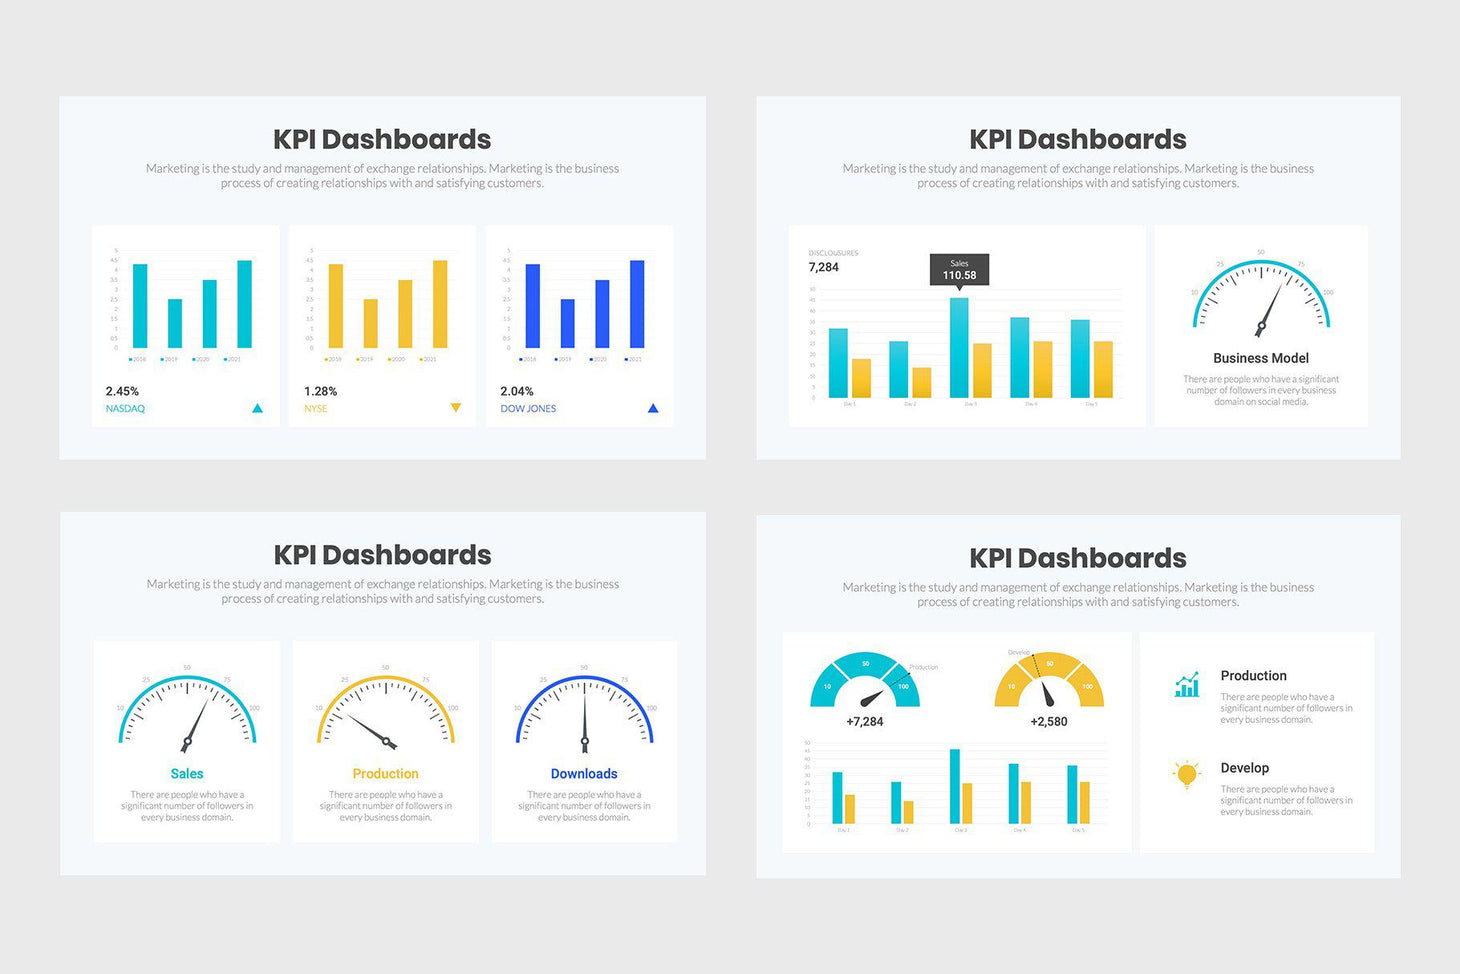
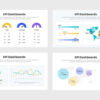
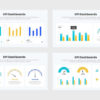
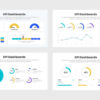
KPI Dashboard Infographics help to break down complex financial information into small, manageable numbers and pie charts that are color-coded. They make it easy for everyone in your organization or business to understand the overall performance of the company. All KPI Dashboard infographics are customizable and personalized within variety parameters.
These infographics are compatible with:
- MS PowerPoint
- Apple Keynote
- Google Slides
Related products
-
Add to WishlistAdd to Wishlist

Reviews
There are no reviews yet.